

In the early 2000s, I was responsible for competitive analysis for IBM’s AS/400, then iSeries and now IBM i platform. On one level, the job was simple: demonstrate how IBM delivers superior technology with lower total cost of ownership (TCO). The tricky part was getting the customer to see all the factors that go into a TCO calculation, especially when the competition wanted to hide much of it.
One factor that we consistently featured — and which continues to play into IBM i’s favor today—is the cost of ownership for a fully-featured relational database management system (RDBMS). Db2 for i provides all the sophistication, performance, and flexibility of the most expensive RDBMSs in the market. And because it’s fully integrated into the operating system, it automates many of the mundane tasks that other RDBMSs require, tasks that necessitate the hiring of a database administrator (DBA). Creating and managing tablespaces, for example, simply does not exist as a task on IBM i.
If you run on IBM i, you will never need to hire a database administrator
Thus, as the competitive analysis leader for the platform, I took great pleasure in telling my audiences, “If you run on IBM i, you will never need to hire a database administrator.” I often quoted the average salary for a DBA and used it in my TCO calculations. I made slides that listed all the boring things DBAs on other platforms had to do, and I described a world where data architects, not mere DBAs, were free to focus on the brainy tasks of defining the perfect index for every query and building systems based on the latest thinking in fully normalized schemas. Truly, it was a data geek’s nirvana.
In all of that list-making and world-building, there was one task I glossed over: documenting the data model. Maybe I assumed those brainy architects were doing it, or maybe I thought the application teams were handling it. In any case, I never stood in front of audience and said, “Even if you don’t have a DBA, you still need to document your data model, and keep it current.”
For that, I must apologize.

Fast-forward to 2019: digital transformation, a game-changing strategy with strong traction and a long list of success stories
Digital transformation is a strategy that gives established businesses a roadmap for digging out of their mounds of technical debt and reinventing themselves as nimble innovators. Household names like Domino’s Pizza, Allstate, and UPS have published success stories.
Their stories are intriguing because they light the way forward for other legacy businesses. Although it’s fun to read about disruptors like Uber and AirBnb, most people in IT do not have the luxury of starting from scratch with millions in venture capital funding.
Legacy businesses must contend with decades of technical debt as they compete against cloud-native applications built on open source technology and with agile development methods.
As one Vice President of Application Development recently told us, “I inherited a platform that was built in 1990 with technology from 1970.” That VP may have been exaggerating just a bit, but his dilemma is all too real: his business must compete in a hyper-accelerated market while carrying forward technical debt from twenty and thirty years ago.
Digital transformation is the imperative, but where is the starting point?
Step Zero in the multi-pronged digital transformation journey is to document and understand the application environment. And for too many IBM i shops, this means documenting the data model for the very first time. Most shops have at least some tribal knowledge of the application itself. Want to know why the payroll system processes year-end bonuses the way it does? Go ask Karen, she wrote the module. Want to know why that one file call loops like that? Go ask Joe, he was an intern when that program rolled out.
But when it comes to the data model, only the largest shops will be able to tell you if their relational model is fourth-normal form or using a star schema. And even fewer shops will be able to produce a current and accurate data model.
Although tempting, it is not advisable to start by displaying libraries and files and hoping that a coherent model will surface from the bread crumbs left on the trail. Application environments are inherently complex, with mismatched data types and inconsistent naming conventions between files. Human sleuthing will deliver half of the results, at best.
Fortunately, there is an automated alternative. X-Analysis, from Fresche Solutions, is a set of tooling that programmatically analyzes an entire application environment. It breaks the application down into X-Analysis Application Areas, which are sections of an internal repository and are based on the business, such as inventory management or warehouse locations. Users are free to choose their own application areas based on their business requirements.
The resulting application model shows how modules and files are related to each other, as well as dead code that is no longer used. And importantly, it documents the data model.
Whether the data is defined with DDS or DDL, X-Analysis can discover the entire model. It will find all the logical and physical files, including the relationships between the files: the primary and foreign keys. X-Analysis can tell you the last time a file was accessed or updated. And it provides long names for all tables and columns intelligently harvested from the existing applications that access the database — a critical feature for analysts who lack the tribal knowledge behind the 10-character field names — often truncated to six characters – from the original application.
With X-Analysis Advisor, you can generate the results into a PDF, giving everyone a “single version of the truth.” And going forward, you can set up X-Analysis to run at regular intervals, ensuring that the documentation is always up-to-date.
In addition to maintaining a current version of the data model, X-Analysis also makes the model interactive. Developers and data engineers can drill down into the model. Starting with the macro view of the model, you can click into specific tables or to see how those tables are interrelated with other tables and application areas. You can see the foreign and primary keys that describe how tables are related to each other.
When X-Analysis completes its work, data architects can see this full data model:

Figure 1: This is an actual data model, not a Rorschach Test
While interesting and impactful, teams can get more usable information by drilling down into it. Analysts can isolate a single application area, which might look like this:

Figure 2: Isolating an application area within the data model
To understand the dependencies of a single table, analysts can click to drill down even further:
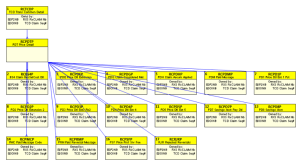
Figure 3: Dependencies between specific tables
With X-Analysis, a documented data model goes hand in glove with a visual representation of the application itself. Armed with this valuable information, teams can start making informed decisions about how to move forward with a digital transformation strategy. The data model unlocks a critical asset that business users and decision makers need in order to move a business forward. In many ways, it is the most critical step in the modernization journey.
The data model is like the key to unlock the treasure chest for the digital transformation
Even if digital transformation is not the goal, having a well-documented application environment is critical for carrying the business forward. And as more and more business logic moves into the database layer through the use of triggers and stored procedures, a strategically-defined data model becomes even more critical.
I really am sorry about that “never need a DBA” line. I said it a lot.