Clover

Advantages of Using Clover

Web-Based Reports
Create web-based reports in minutes with DB2, MySQL, and MS SQL templates that generate the HTML and SQL for you.
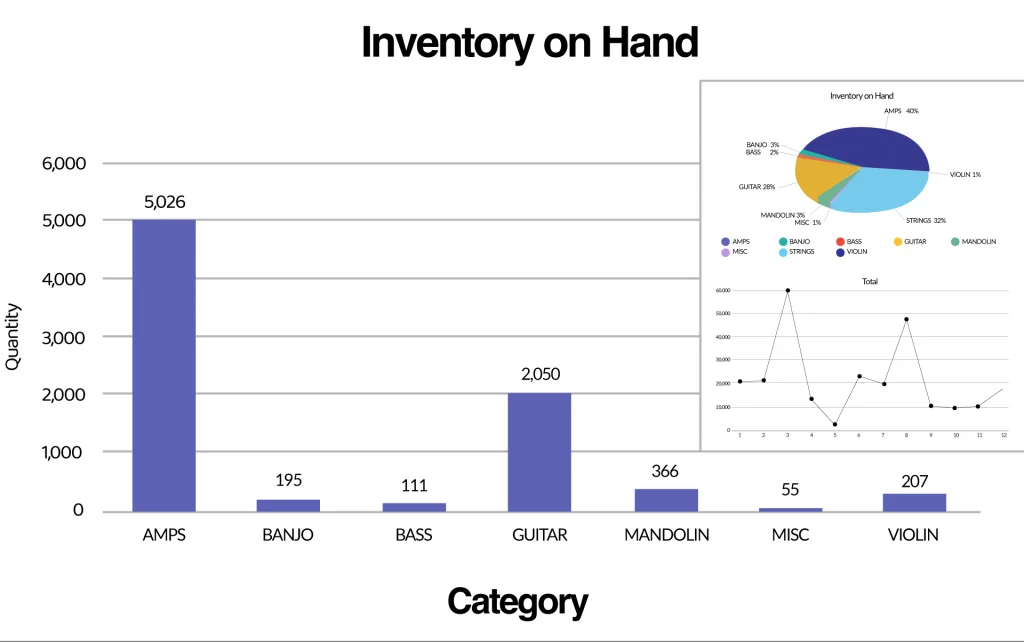
Charts and KPIs
Produce graphical reports that are easy to interpret so users can analyze KPIs from desktops or mobile devices.
Dashboards
Visually display data in dashboards so decision makers can see the big picture and drill down to the details.Want to learn more about Clover?
Not sure where to start? Our experts are here for you.